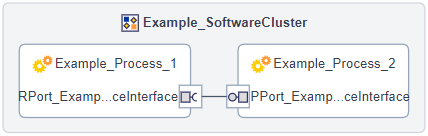
Software Cluster Overview
The
 Software Cluster Overview page shows a graphical
overview of all contained processes and their connections within a
Software Cluster. It supports you to visually track processes and
connections and can be used as a navigation point for adjustments within
a software cluster.
Software Cluster Overview page shows a graphical
overview of all contained processes and their connections within a
Software Cluster. It supports you to visually track processes and
connections and can be used as a navigation point for adjustments within
a software cluster.
Graphical Elements
| Element | Description |
|---|---|
Software Cluster |
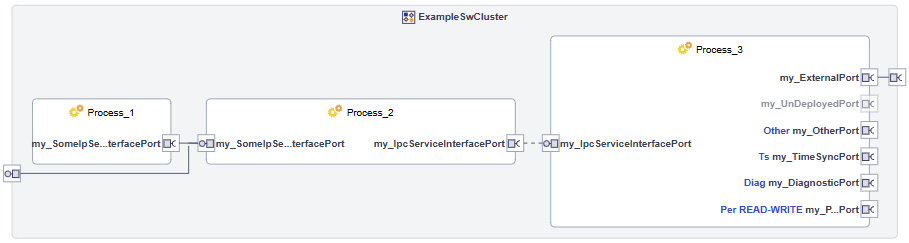
The Software Cluster is displayed as light gray rectangle in which all other graphical elements are located.
|
Process |
Processes are displayed as rectangles.
|
Port Prototype |
Port Prototypes are displayed with their name as
Port Types A blue abbreviation attached to the port name indicates the port type.
Access Mode For Persistency Ports, a blue hint attached to the port name indicates how persistent data can be accessed.
Unused Ports Service Interface Ports that are not associated with a service or have an undeployed service are grayed out. Further modeling is necessary. |
SOME/IP Connection |
SOME/IP Connections are displayed by a solid line.
|
IPC Connection |
IPC Connections are displayed by a dashed line.
|
External Connection |
External Connections are displayed by a port that goes outside of the software cluster. This shows a service interface port with a deployed interface that does not match up with another port inside the same Software Cluster. |







Toolbar
The toolbar on the top right of the Software Cluster Overview provides the following features:
-
 Filter: Provides a dropdown menu in which you can
select which elements should be displayed. The corresponding elements
are hidden when the following options are selected:
Filter: Provides a dropdown menu in which you can
select which elements should be displayed. The corresponding elements
are hidden when the following options are selected:-
Service Interface
-
Diagnostic
-
Persistency
-
Timesync
-
Others
-
Internal
-
External
-
Used
-
Unused
-
SOME/IP
-
IPC
-
-
 Fit to Screen: Adjusts the overview graphic to the size
of the window so that all elements are visible.
Fit to Screen: Adjusts the overview graphic to the size
of the window so that all elements are visible. -
 Export SVG: Opens a window to export the overview
graphic as an SVG file.
Export SVG: Opens a window to export the overview
graphic as an SVG file. -
 Collapse Details Part /
 Expand Details Part: Collapses or expands the detail
field shown on the right.
Expand Details Part: Collapses or expands the detail
field shown on the right.
Functionality
The Software Cluster Overview provides the functionality listed below:
-
Highlighting direct connections:
If you click on a graphical element, it is highlighted together with all directly linked elements. If you only want to see the graphical element with all direct connections, you can select Set in Focus via the context menu of the selected element.
-
Detail field:
By clicking on a graphical element, the detail field gives you information about the clicked element and its connections. It provides links that navigate you to the appropriate editors for configuration.
The detail field is activated by default.
-
Dynamic Scaling:
Zooming out removes port names and enlarges process names to provide a simpler overview.
How To Display a Simple Model
List of Requirements
The following describes the minimum requirements for displaying a simple model with 2 connected processes:
-
One Service Interface with a Service Interface Deployment and two Service Instances, one for each direction (provided/required).
-
The Service Instances must have the same Instance ID and Service Version.
-
The two Service Instances are mapped to separate provided and required Port Prototypes of two Executables.
-
Both Executables are deployed as processes, which are added to one Software Cluster.
Step-by-Step Guide
The following describes the requirements using a step-by-step guide:
-
Create a Service Interface in the Service Editor by clicking the
 icon at the
top left.
icon at the
top left. -
Create two Executables with Adaptive Application SW Component Types.
-
Create matching Software Interface Ports (provided/required) for the Adaptive Application SW Component Types of both Executables.
Example: A provided Service Interface Port for Executable 1 and a required Service Interface Port for Executable 2.
-
Create Processes for both Executables.
-
Create a Software Cluster in the Software Cluster Editor.
-
Select Contained Processes under the Software Cluster.
-
Select the processes under Available Processes and add them to the Software Cluster by clicking the
 icon.
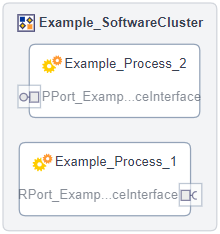
icon.The Software Cluster Overview displays the contained processes without a connection.
-
Create a Service Interface Deployment for the Service Interface.
-
Create two Service Instances, one for each provided and required direction, and map them to the appropriate ports.
Use for both Service Instances the same Instance ID and Service Version.
The Software Cluster Overview displays the contained processes with connection between the ports.