Script Debugging
IntelliJ
-
Access Debug Options
-
Navigate to the script project’s remote debug options
-
Copy the remote debug options
-
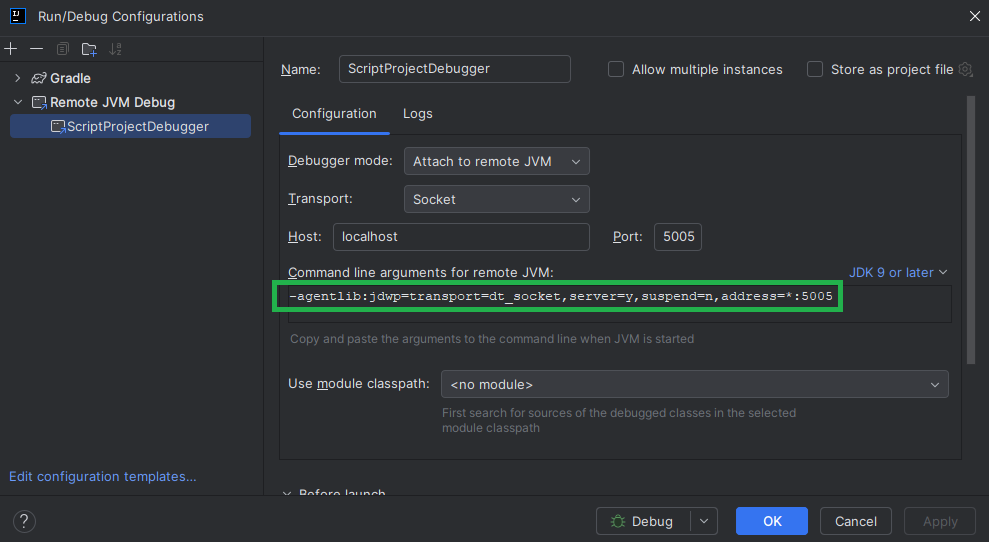
-
Set Up Shell Environment
-
Open a shell terminal and navigate to the core directory of the DaVinci Configurator installation
-
Set the
DVCFG_JVM_ARGSenvironment variable in the shell with your copied remote debug options. Note: Modify the suspend flag to suspend=y to enable the wait-for-debugger mode. -
Verify the correct shell configuration:
echo $env:DVCFG_JVM_ARGS
-

-
Start Debugging the Script Task
-
Use the opened shell terminal to start the script task as usual.
-
Set the desired breakpoints in the script code
-
After the script task is started, the DaVinci Configurator will wait for a debugger to connect.
-
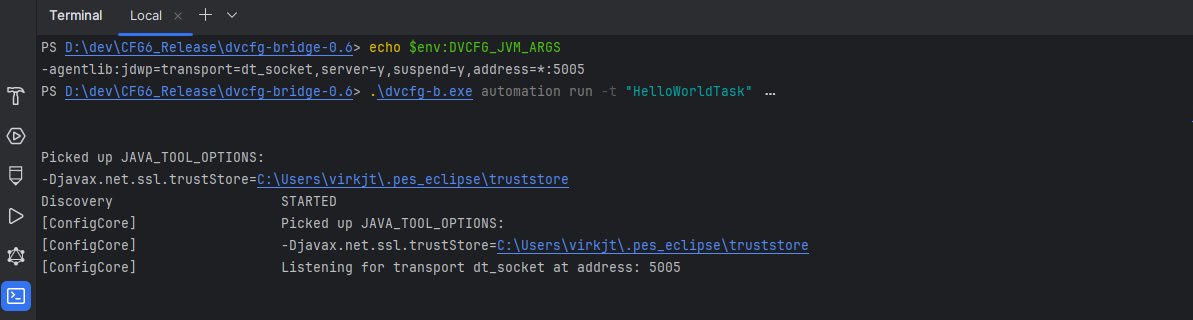
-
Now attach your script to the DaVinci Configurators script task execution process, by activating the remote debugging in the script project.
